GEOVIEW / FIELD 3D

From the subsurface to its thermal evolution.

Five connected perspectives to understand the geology, interpret boreholes and explore the thermal response of the ground over time.

01 / 05THE SUBSURFACE

Everything begins beneath our feet.

Before studying the thermal behaviour of an installation, we need to understand the ground. GeoView brings together stratigraphy, aquifers and borehole geometry in a three-dimensional representation that places each element in its geological context.
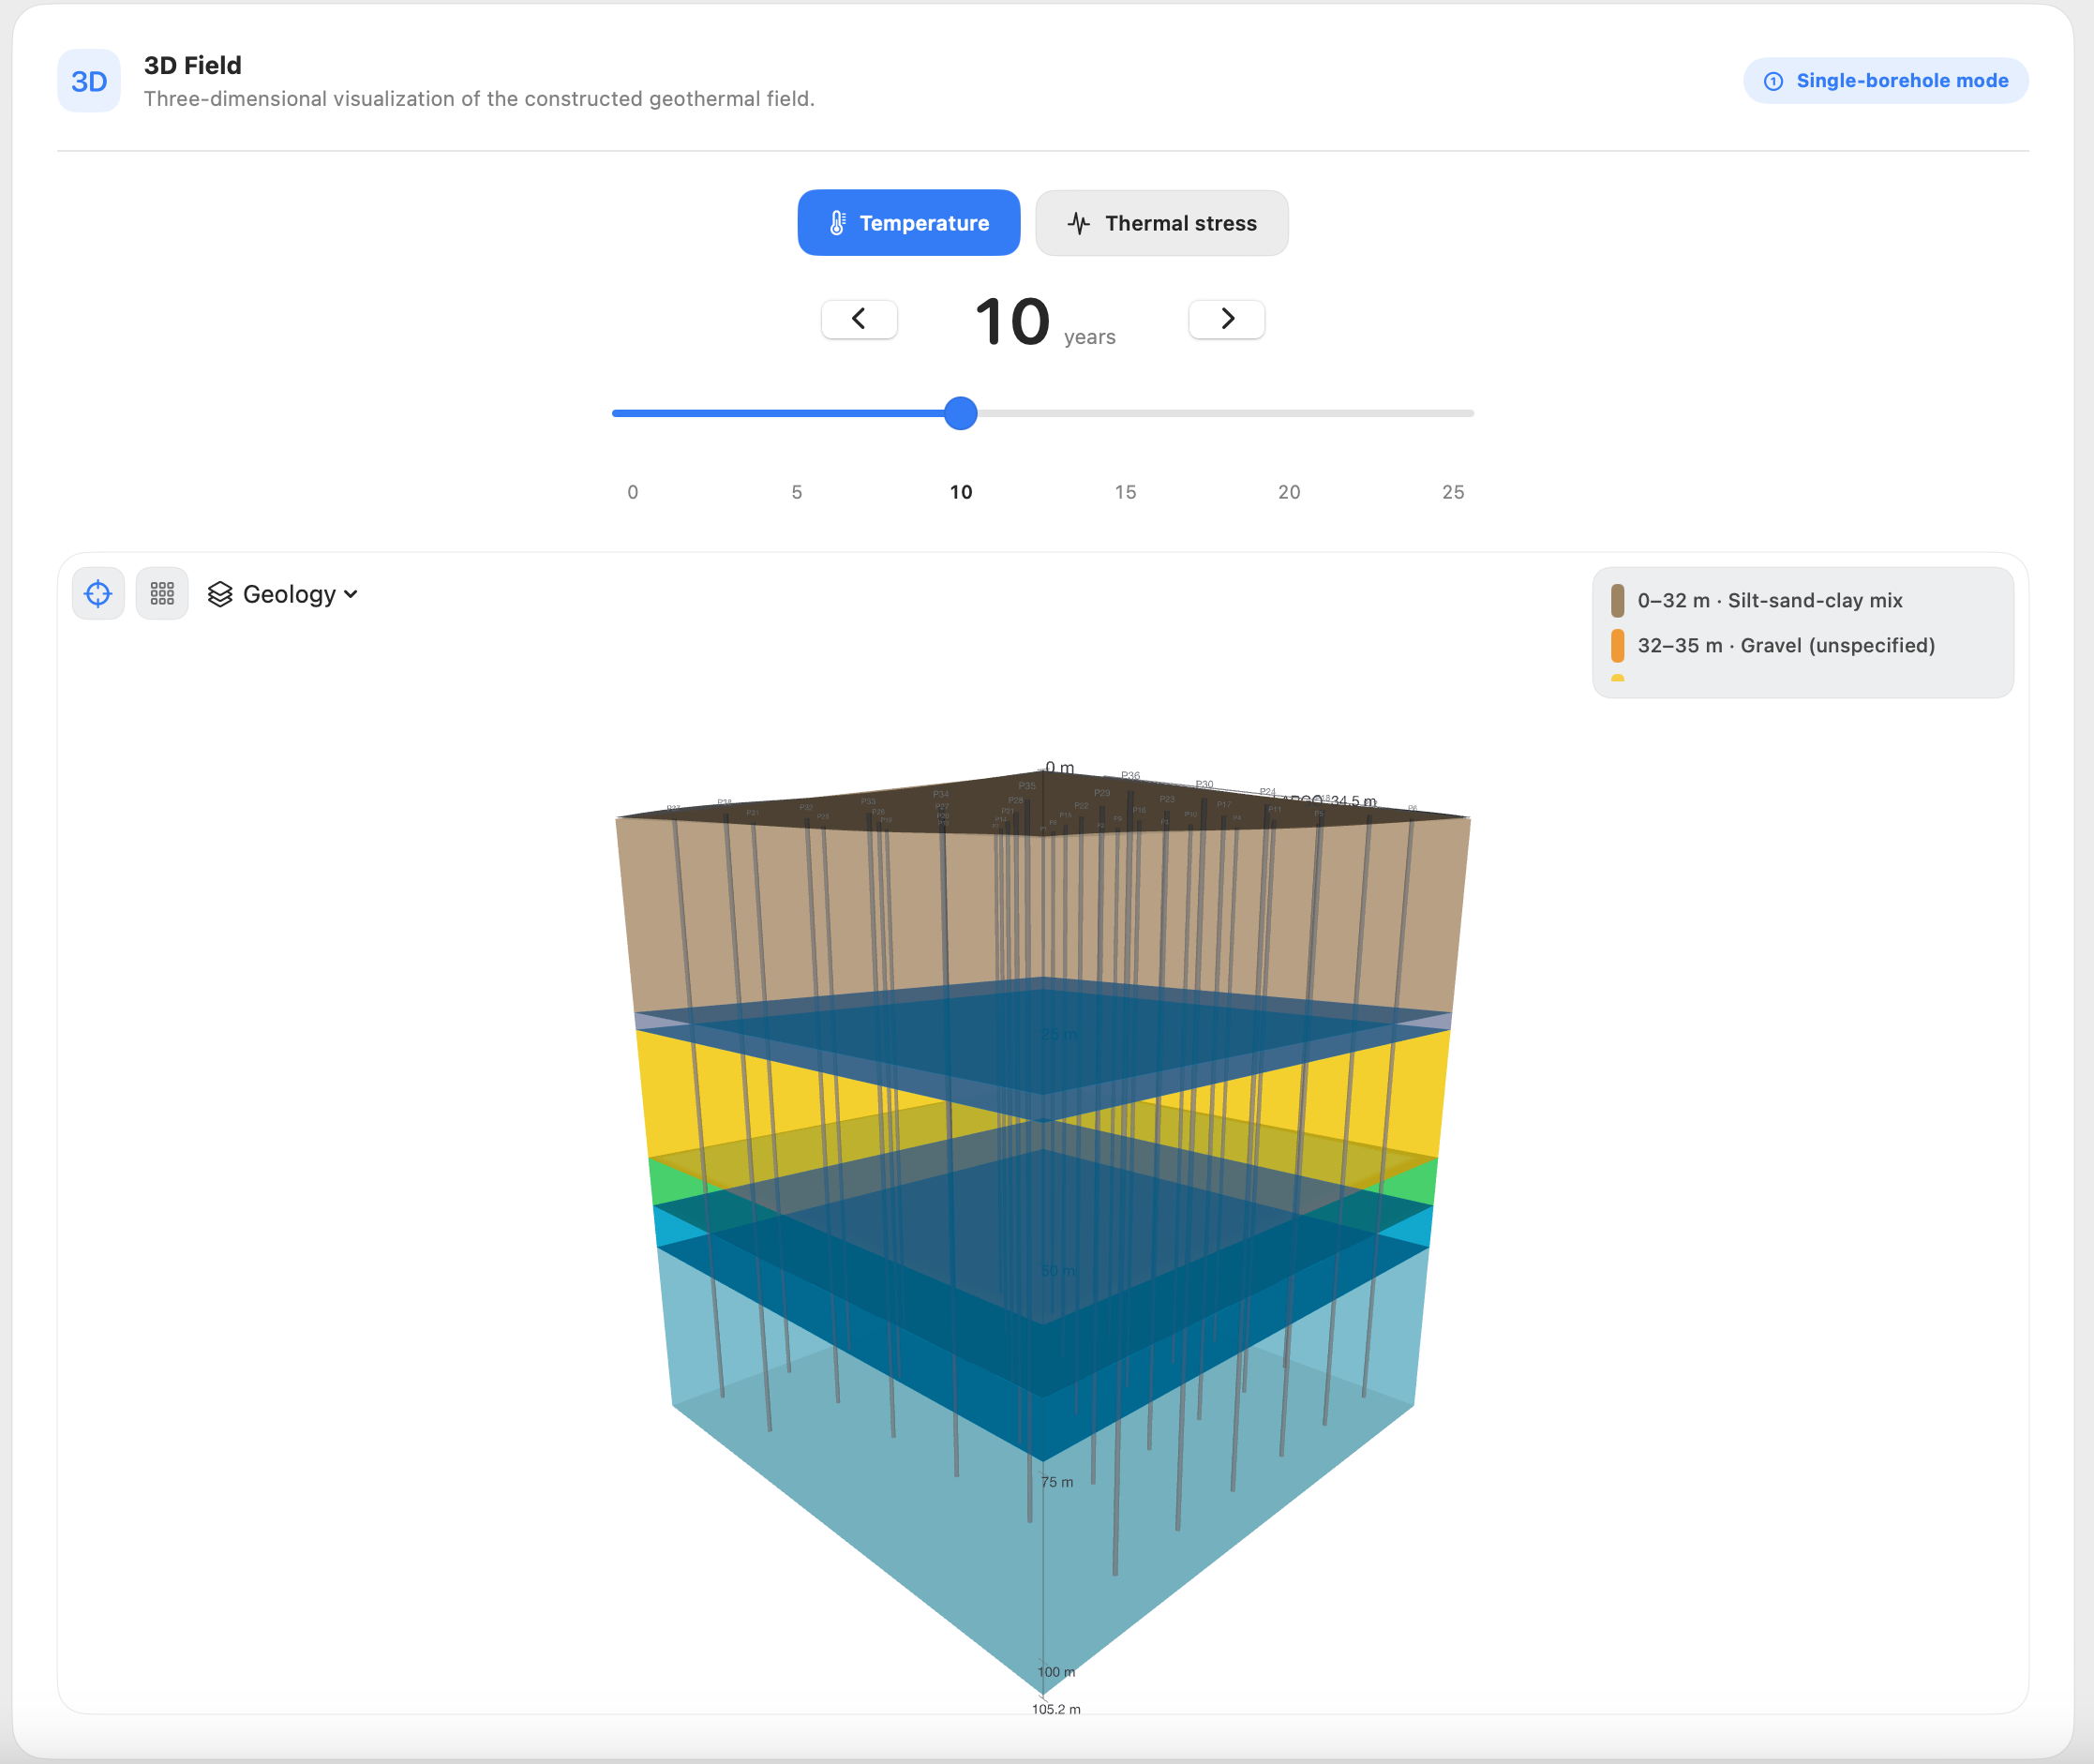
Three-dimensional subsurface model showing geological layers, aquifers and boreholes.
02 / 05THE GEOTHERMAL FIELD

From a single borehole to an entire field.

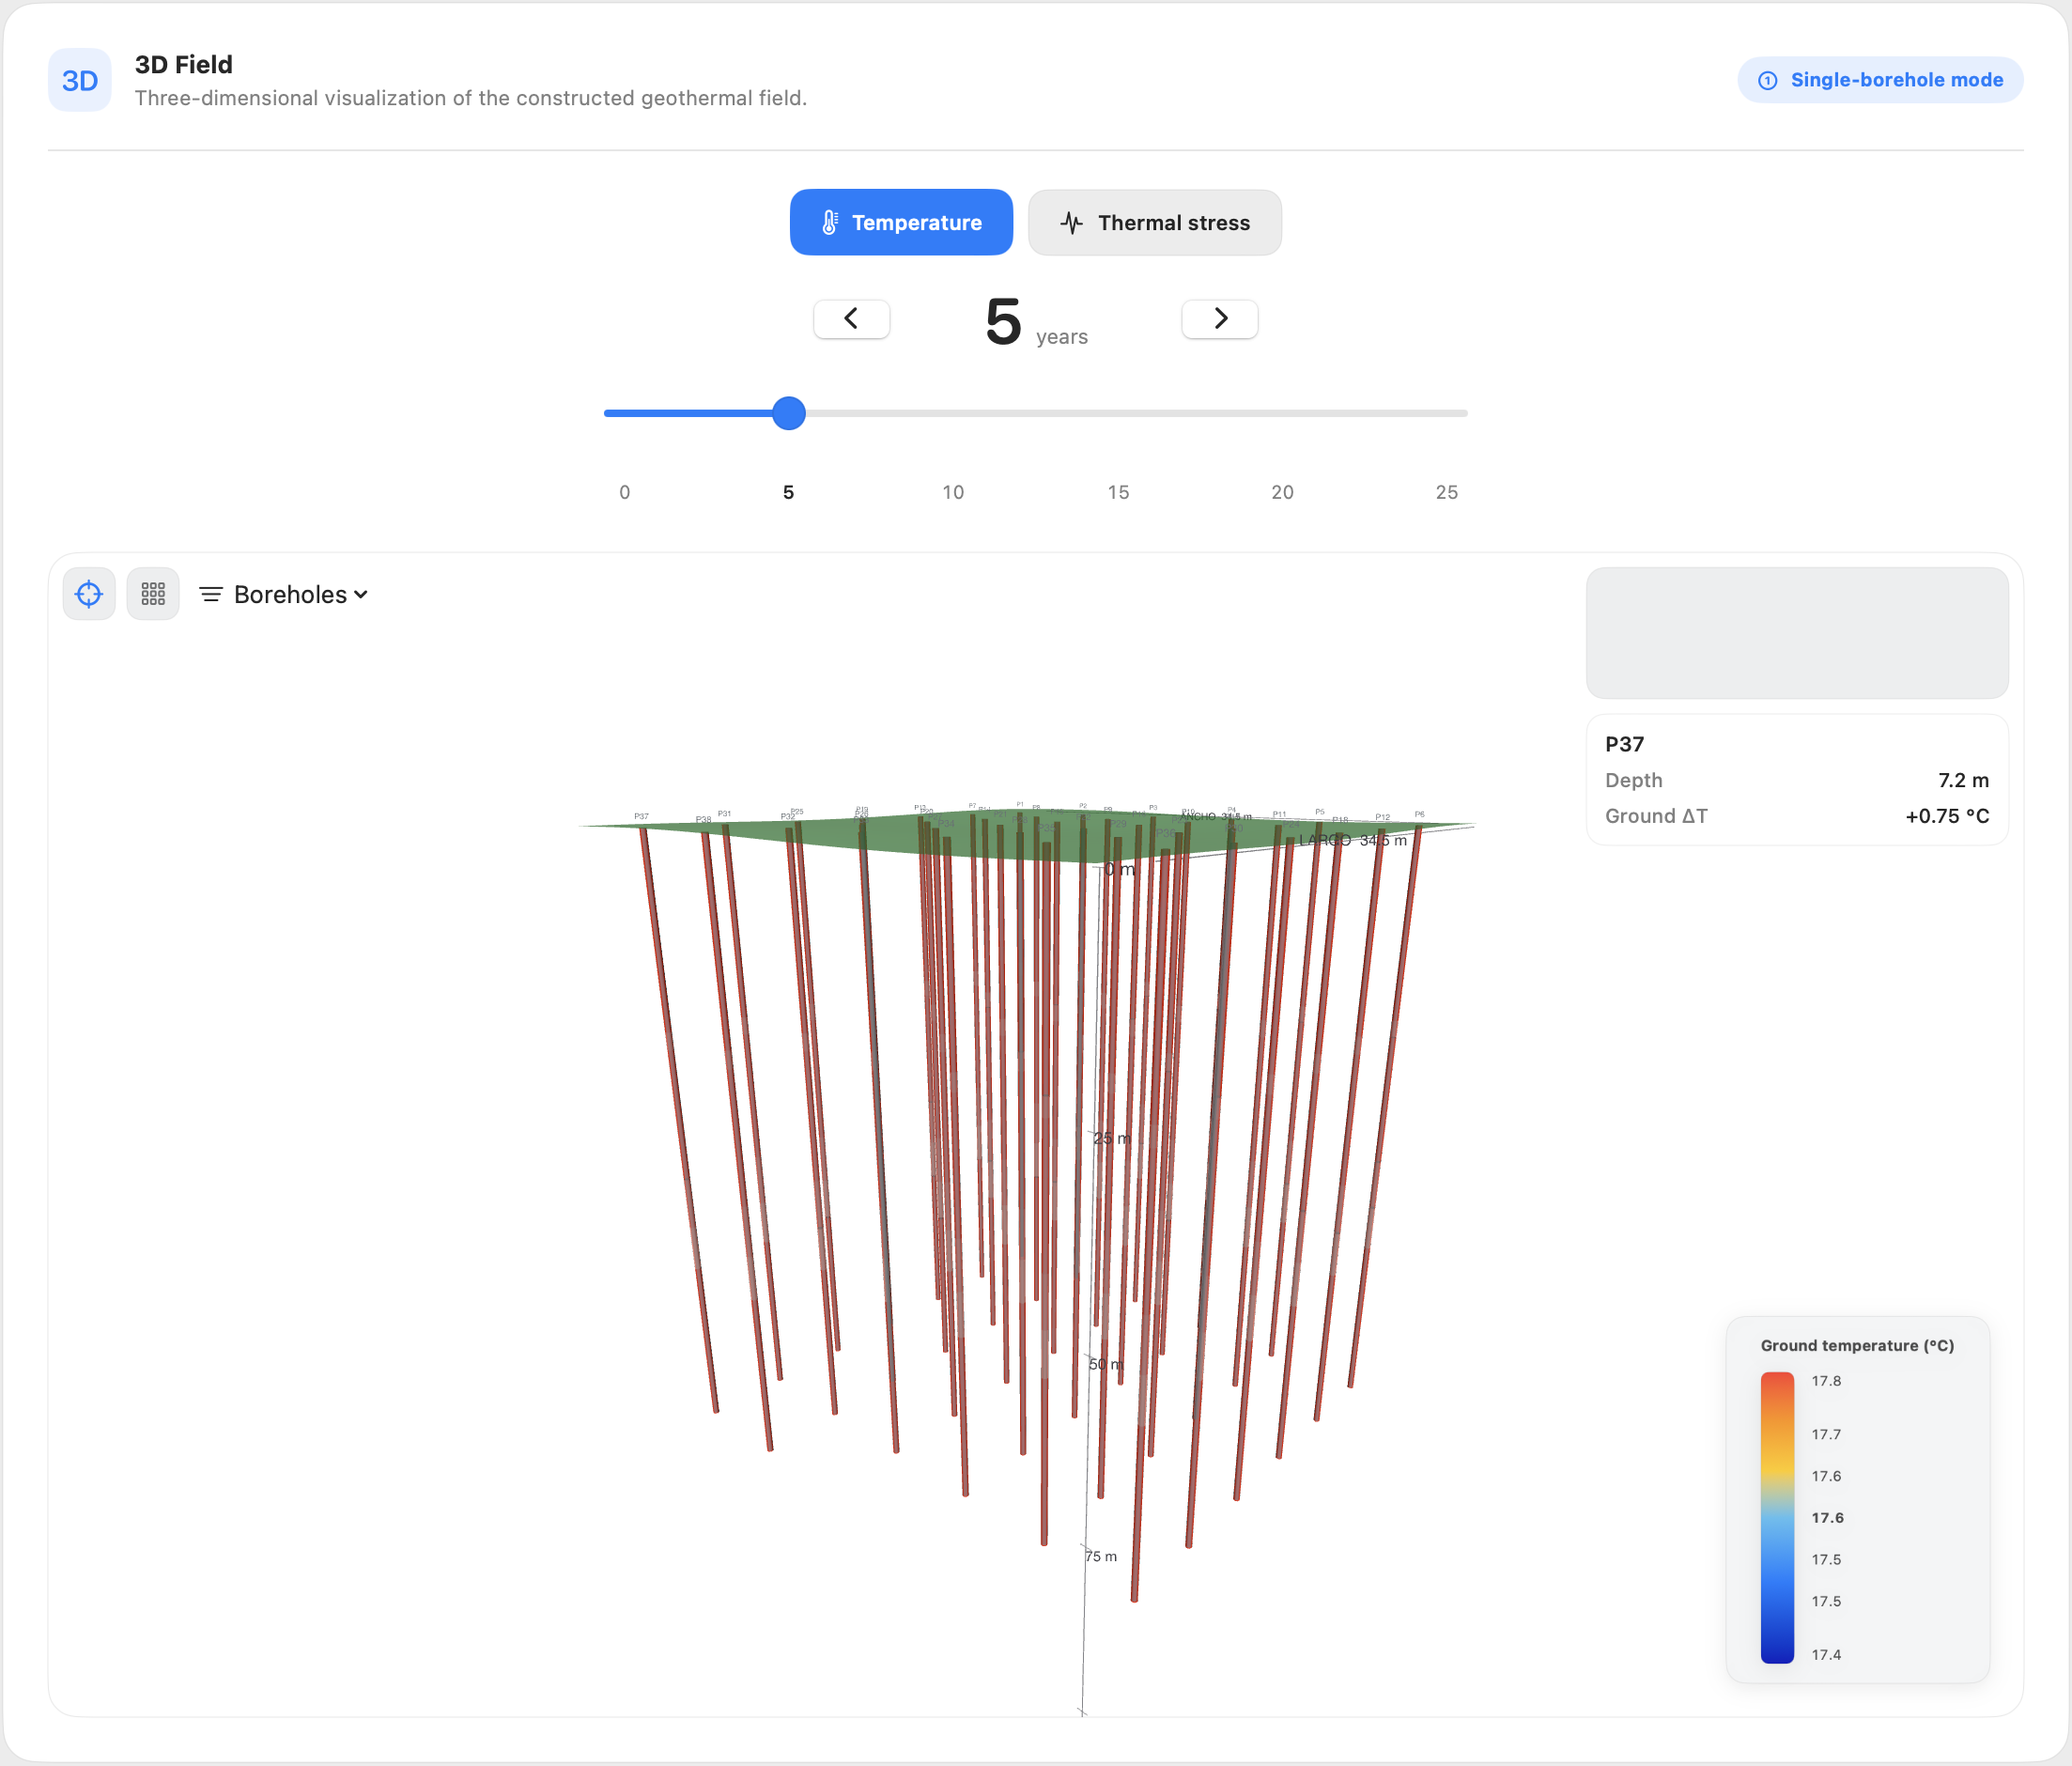
Each borehole heat exchanger has its own position, depth and thermal response. GeoView makes it possible to examine the entire field, compare the behaviour of individual boreholes and track their evolution over the simulation period.

Three-dimensional geothermal borehole field showing multiple boreholes and their thermal behaviour.
03 / 05THE DETAILS

Every metre of depth matters.

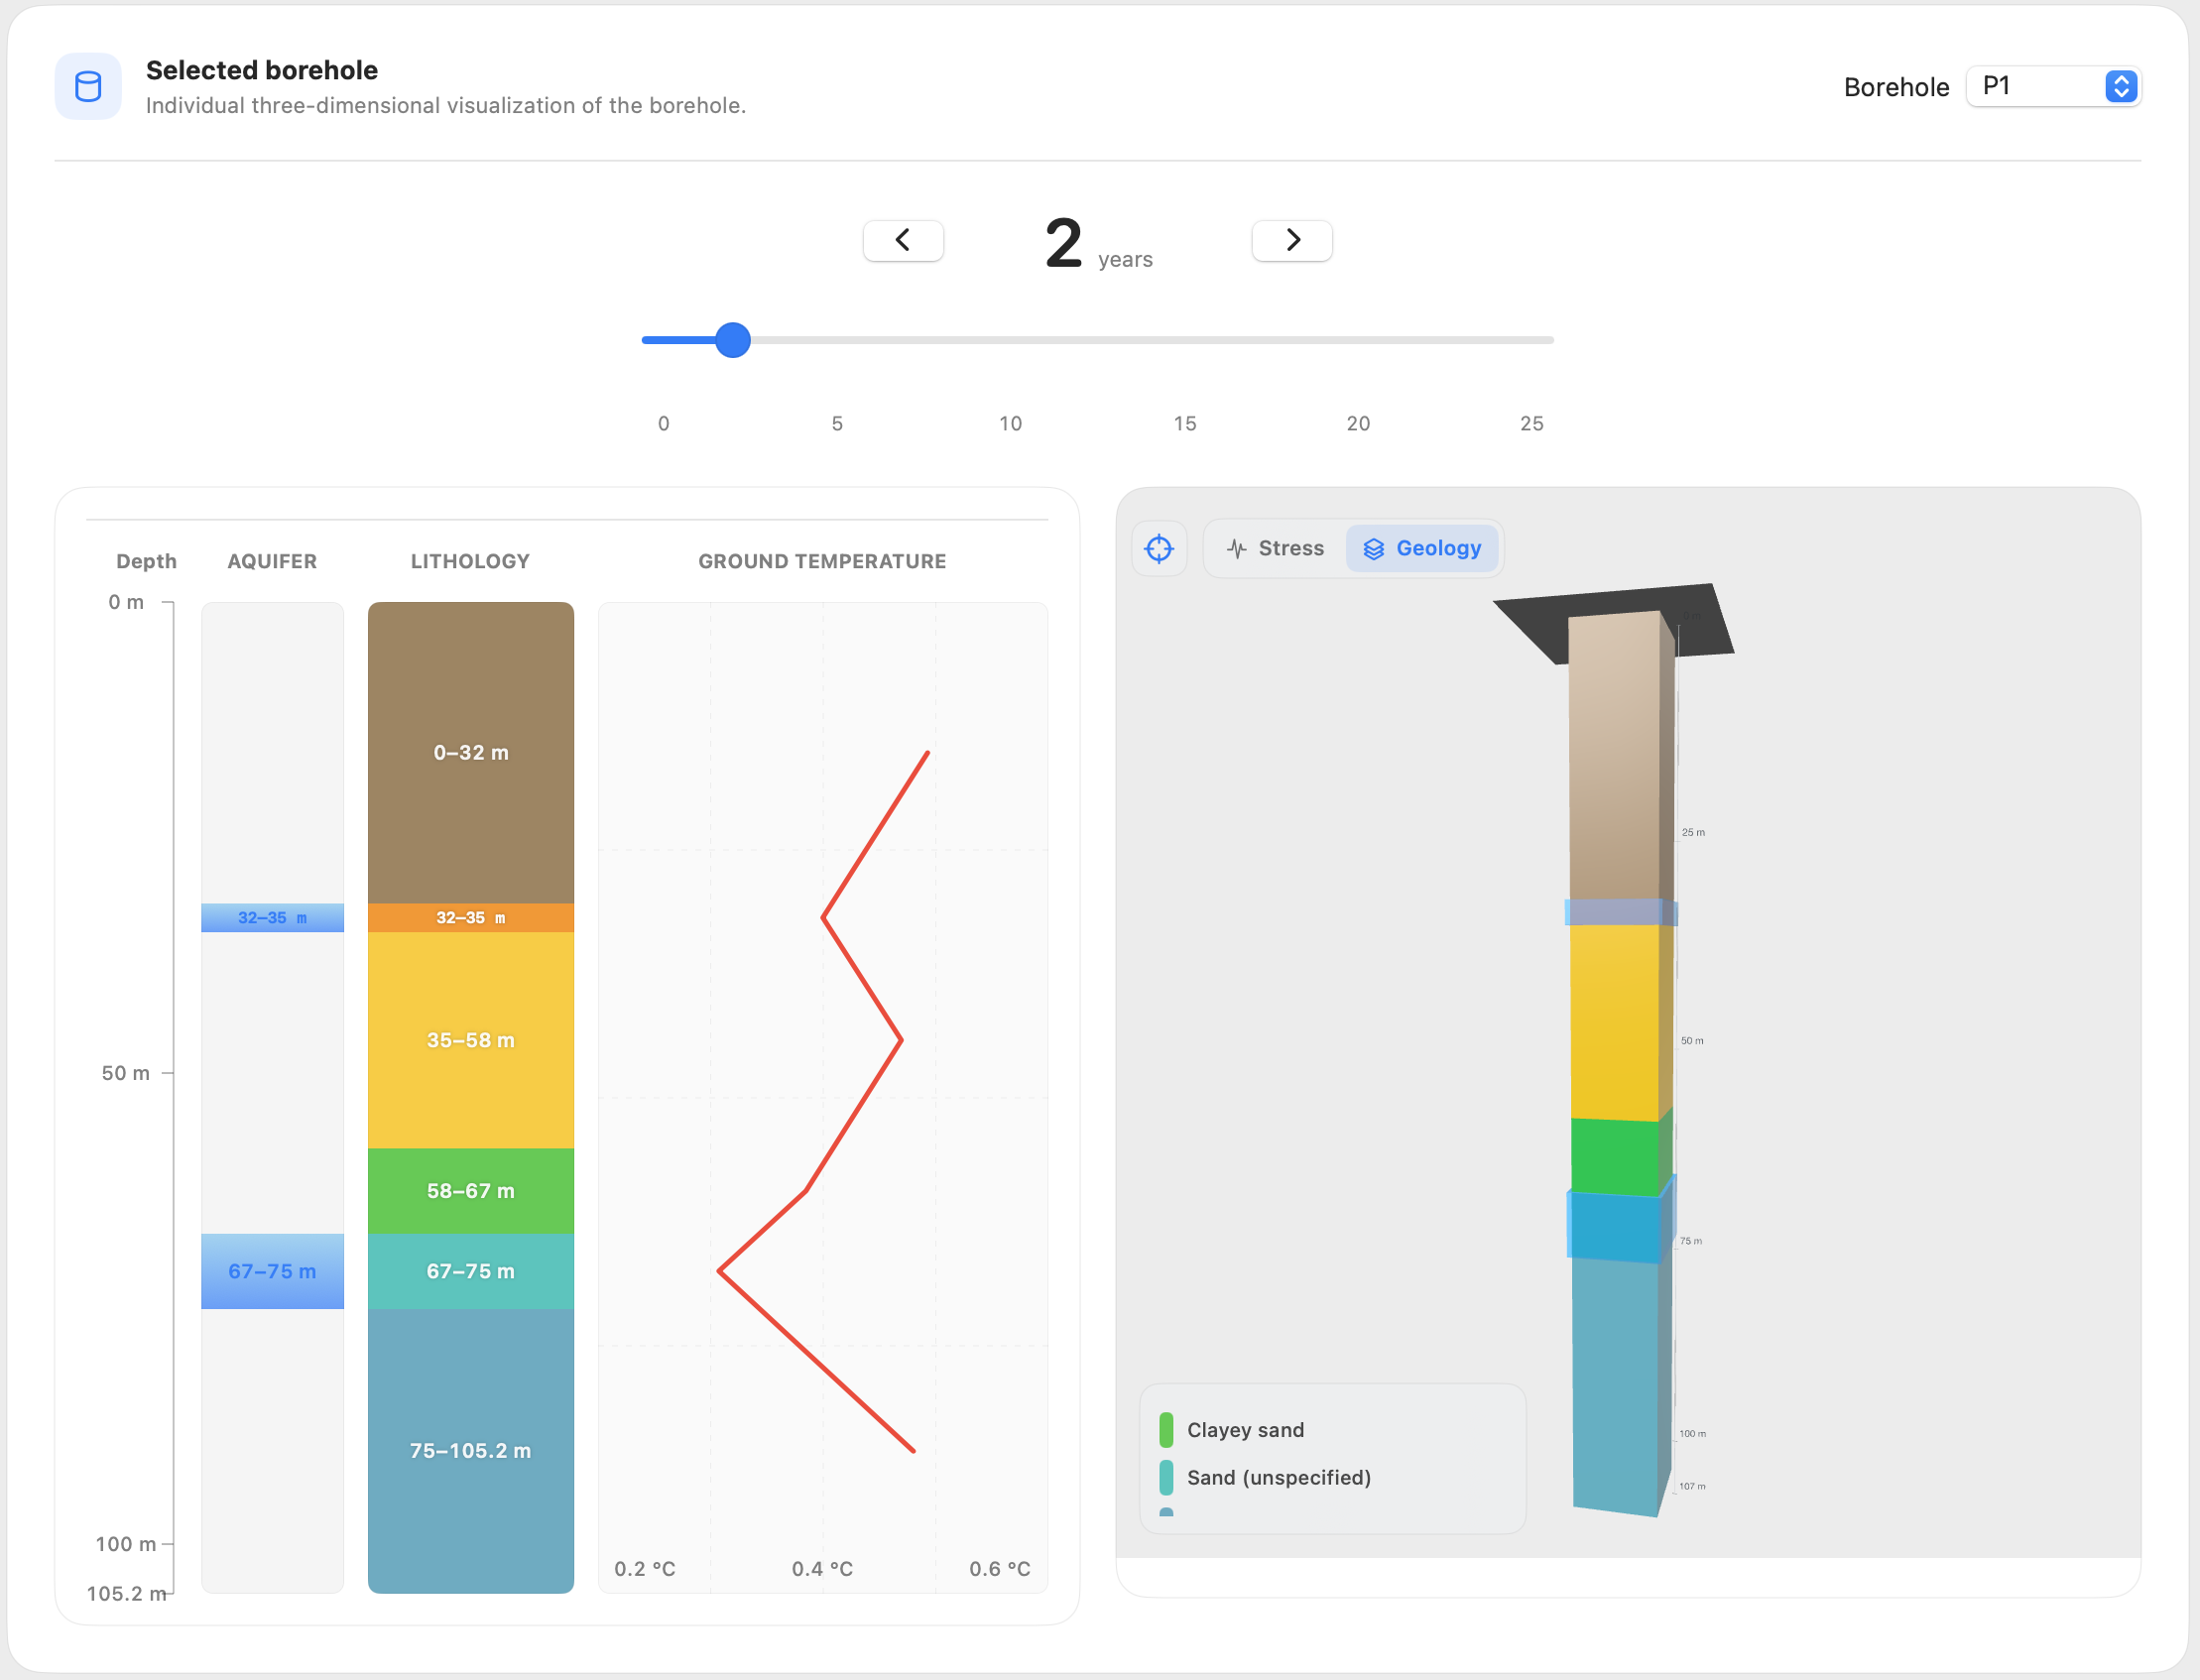
The overall view gives way to individual analysis. For each borehole, GeoView brings together the lithological column, aquifers and temperature profile with depth, preserving the identity and characteristics of each borehole heat exchanger.

Individual borehole analysis showing a lithological column, temperature profile and three-dimensional view.
04 / 05THE GROUND VOLUME

The ground has a thermal history too.

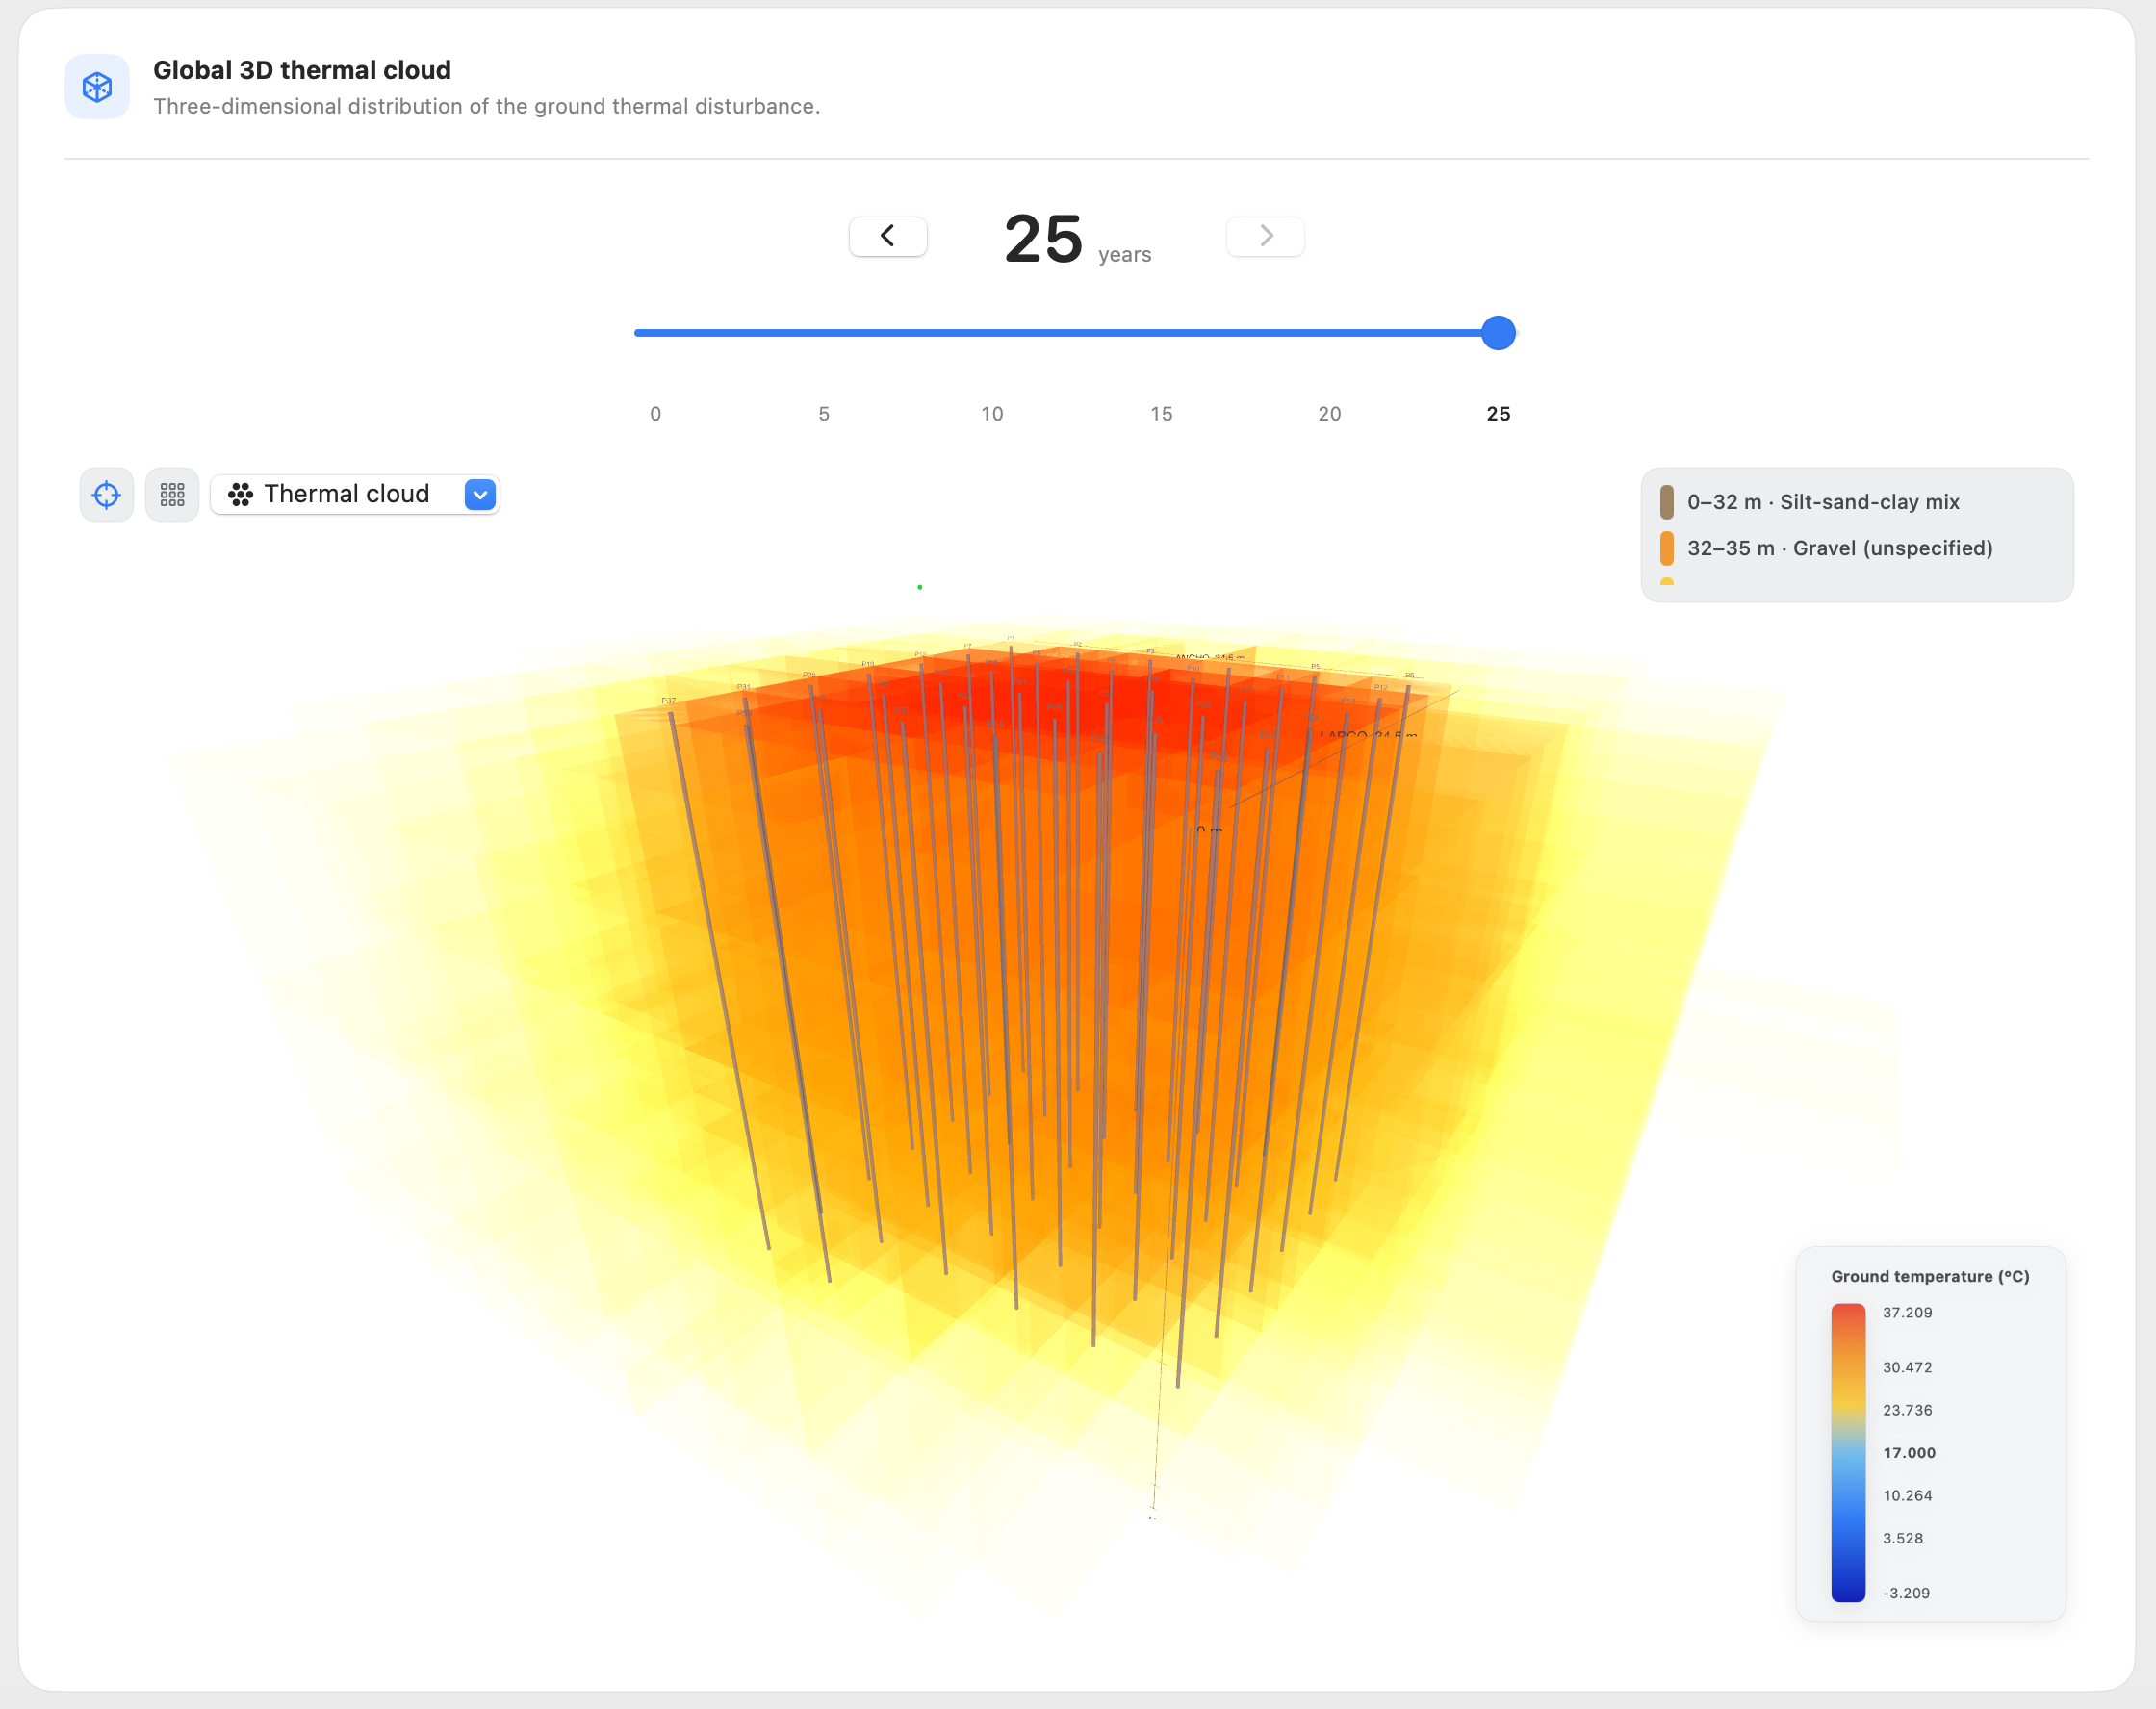
The analysis extends beyond the borehole walls. A three-dimensional finite-volume numerical model makes it possible to explore how thermal disturbances spread through the ground and evolve over time.

Three-dimensional thermal plume in the ground surrounding a geothermal borehole field.
05 / 05INSIDE THE FIELD

See what happens beneath the surface.

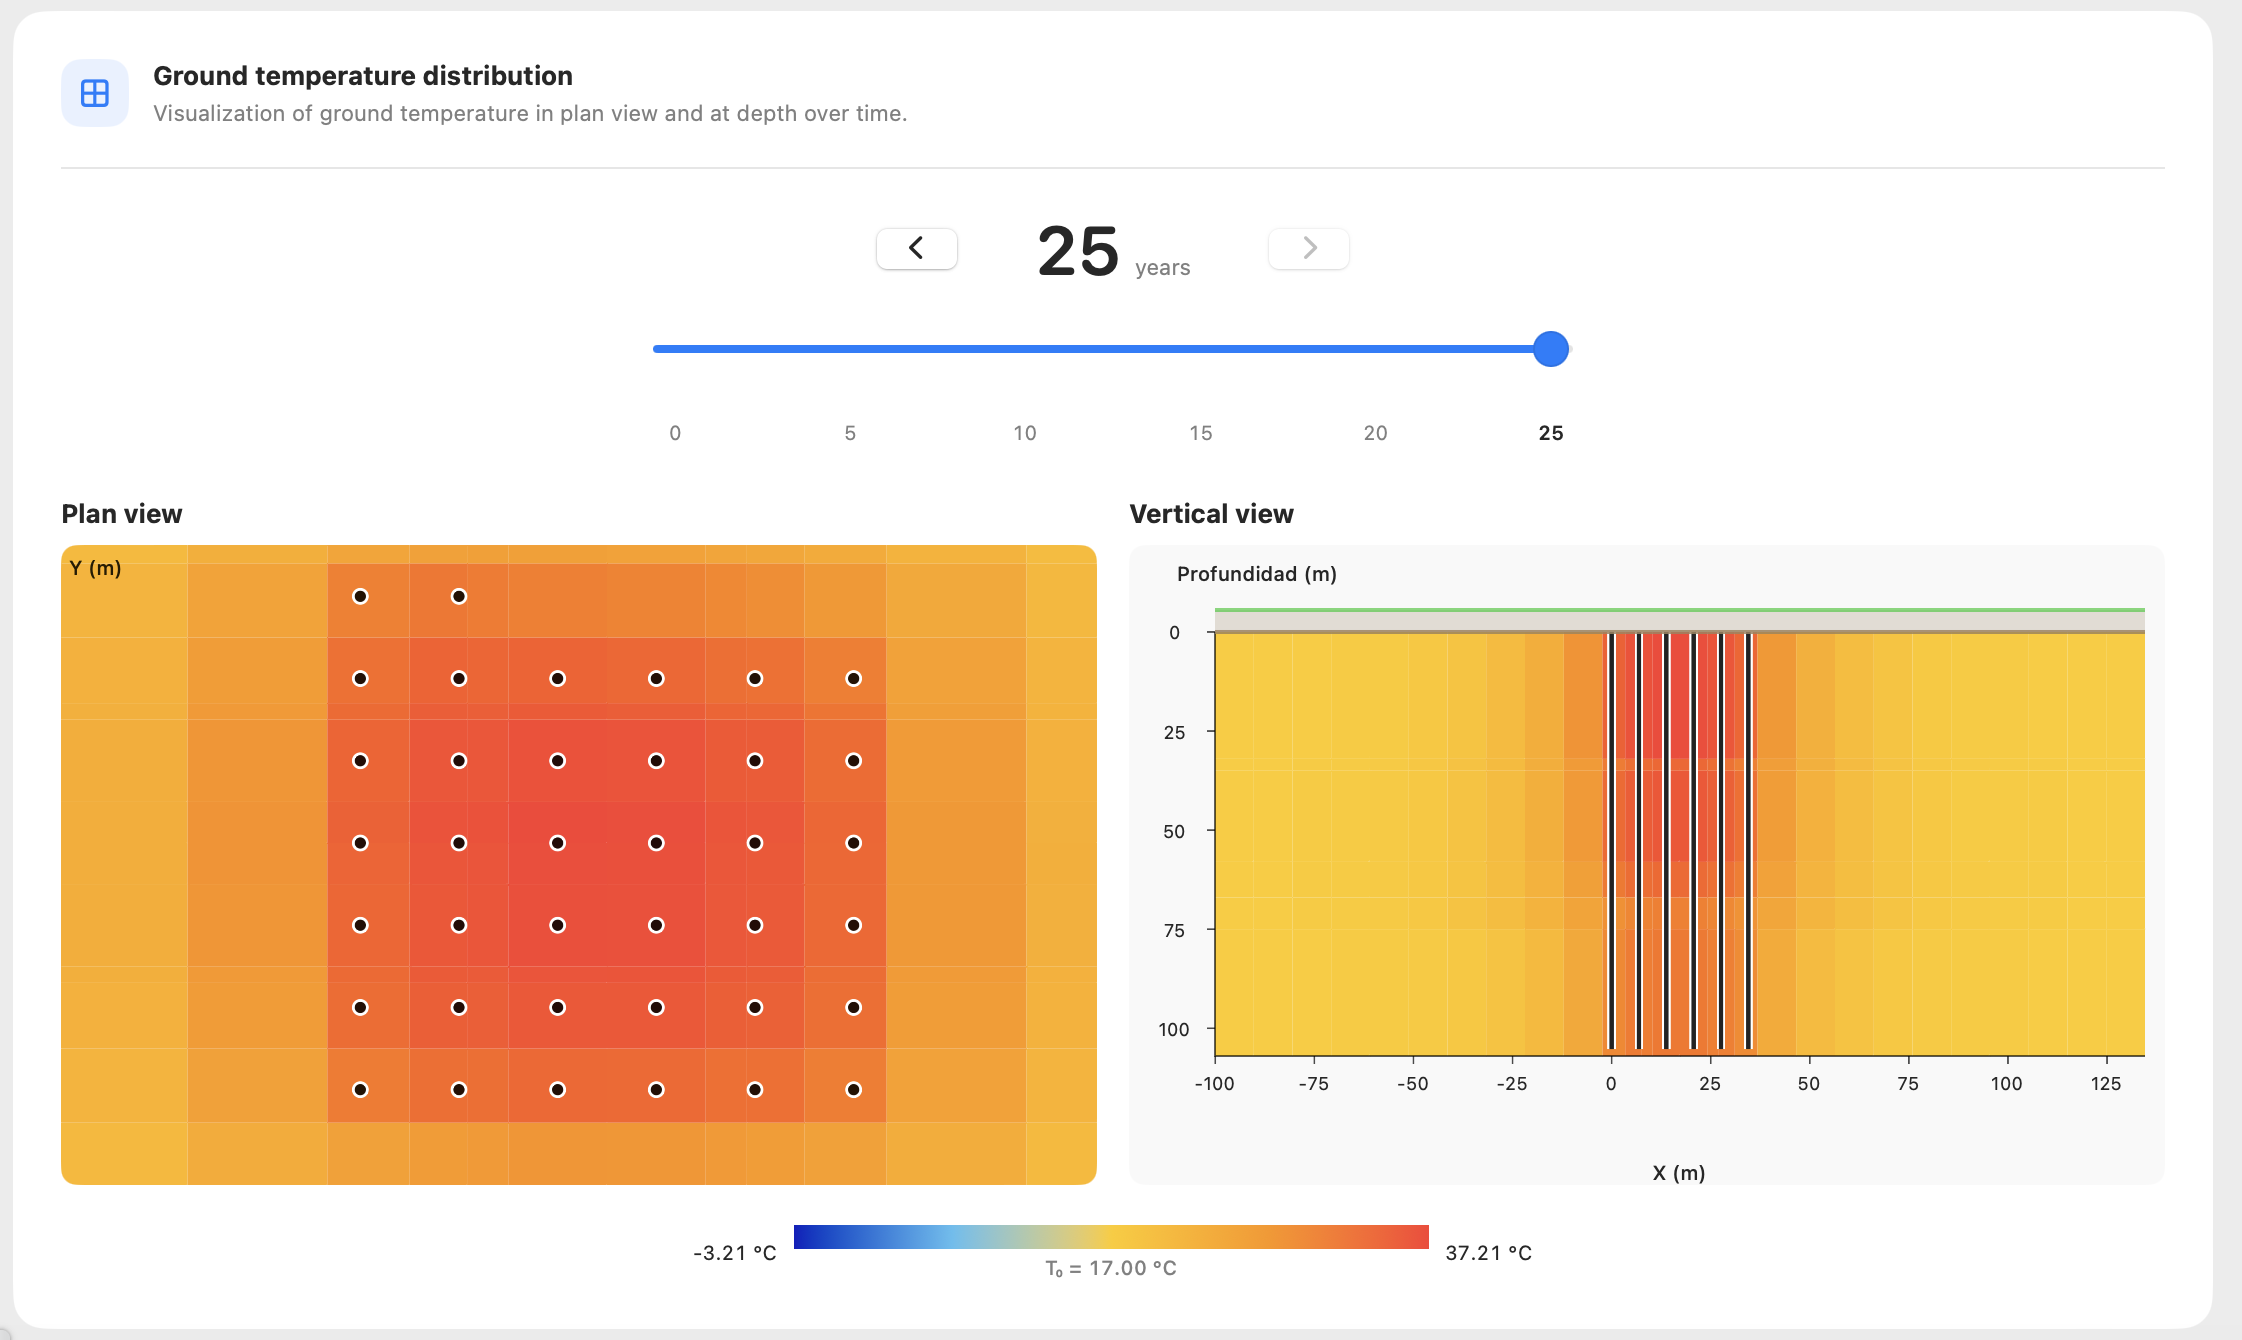
Horizontal and vertical sections reveal another perspective on the thermal field. They make it possible to examine temperature distribution in plan and at depth, identify areas of temperature concentration and compare different stages of the simulation.

Ground temperature distribution shown in horizontal and vertical sections.